Reigning Hope
|
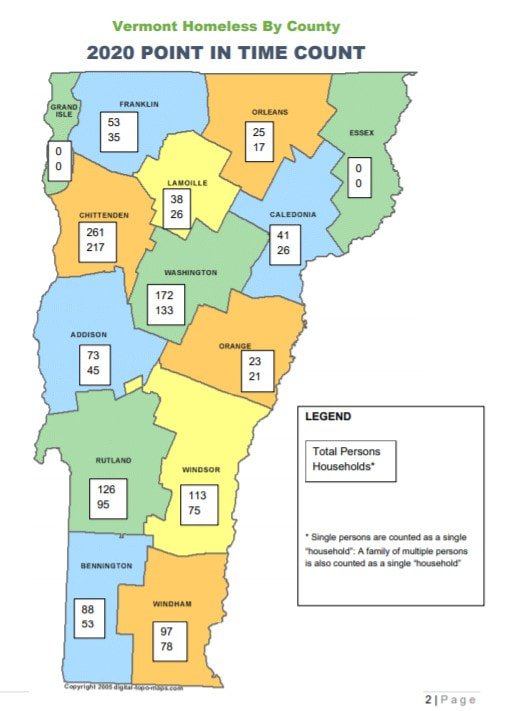
The map and charts on this page come from the US Government's
annual Point in Time count of homeless done in late January each
year by the Housing and Urban Development (HUD.) These figures
roughly approximate the needs for homeless in each county
that were housed in hotels.during covid.
Figures were sketchy during Covid and this page was not updated. We will work on posting 2024 updates. For now here is a summary statement of those findings.
While Vermont’s housing and homelessness crisis was not created overnight and will not be solved overnight, our federal, state, and local political leaders must do everything in their power to move Vermont toward the basic right of housing for all. Summary of 2024 PIT Count Findings:
3,458 - Number of unhoused people, representing an over 300% increase over pre-COVID levels (1,110 unhoused people in 2020).
166 - Number of people did not have access to emergency shelter, representing an over 21 percent increase over 2023 (137 unsheltered people in 2023).
309 - Number of unhoused people who were fleeing domestic or sexual violence.
855 - Number of unhoused people who had a serious mental illness.
568 - Number of unhoused people with a long-term physical disability.
254 - Number of unhoused people with a developmental disability.
107 - Number of unhoused people who were veterans.
737 - Number of unhoused people who were children (under 18).
199 - Number of unhoused people who were over 65 years old and
646 - unhoused people who were 55 years old or older.
5.6 times - Number of times more likely Black Vermonters are unhoused compared with white Vermonters.
Over 35 percent were unhoused for more than one year and over 72 percent were unhoused for more than 90 days.
The graphs below are from 2020 similar data for each county for 2024 can be found in Appendix A starting on page 14.
DV = Domestic Violence MH = Mentally Handicapped SUD = Substance Use Disorder
Proudly powered by Weebly